Skip to content
Intellisia

03 · Run · Signature offer

Intellisia Control Tower.

From boardroom to ground zero. One live view, so every level acts before issues escalate.

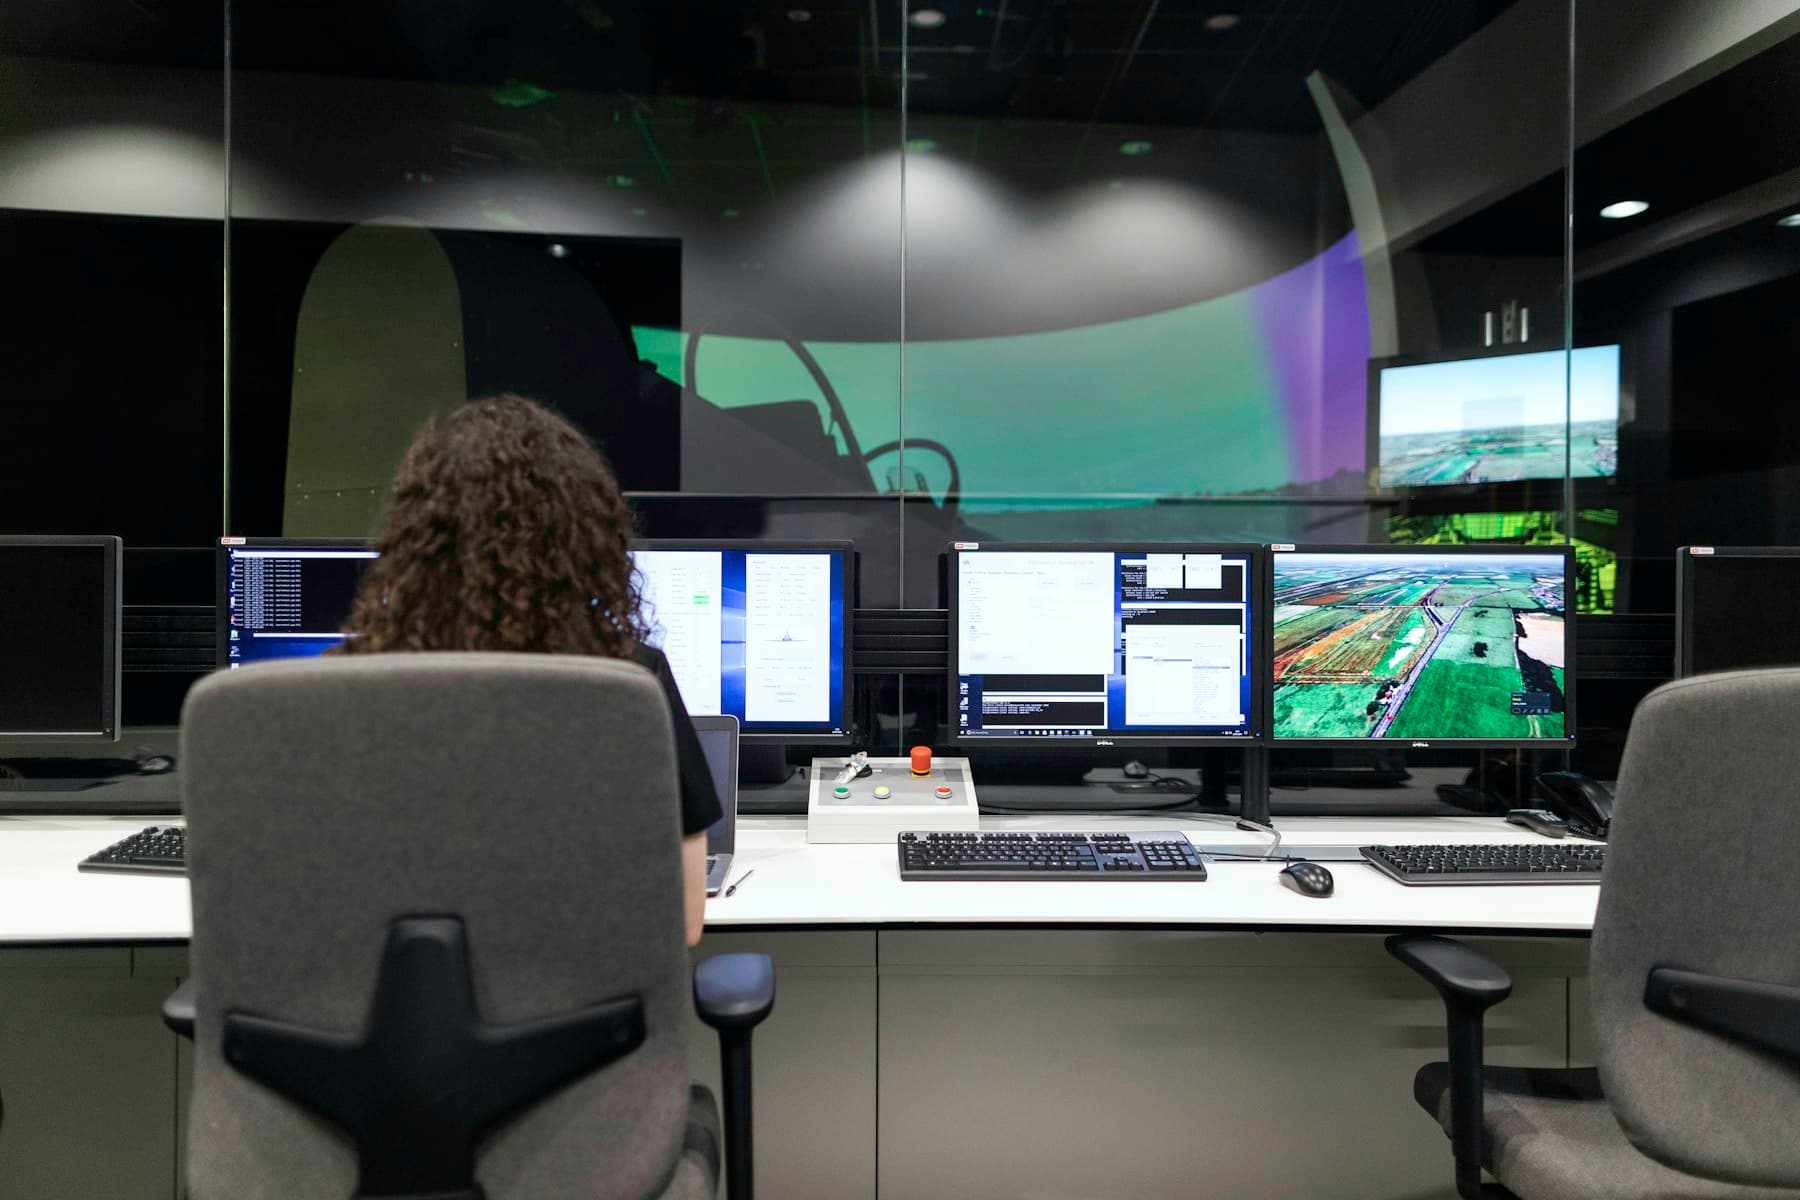
An operator at a control desk reviewing live dashboards

What it brings together

Six feeds. One view.

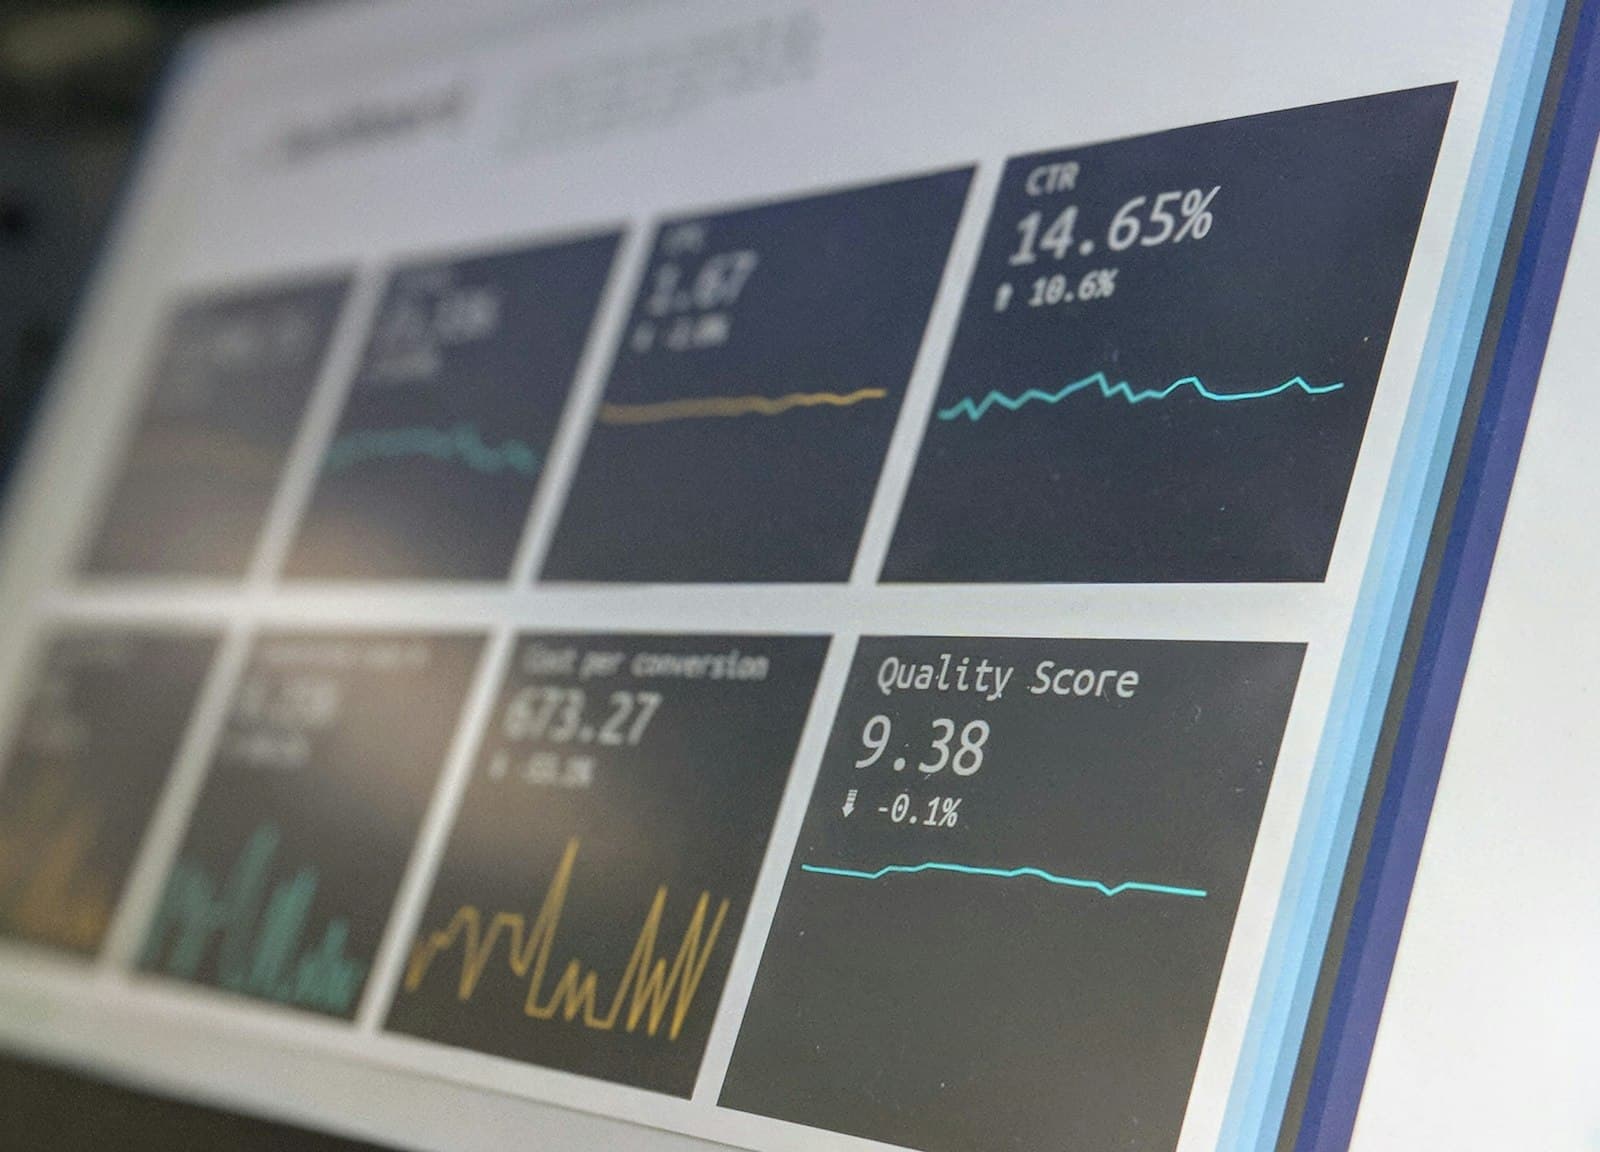
Operational dashboards showing live performance metrics
  1. 01

    Utility logs

    Meter readings and out-of-range alarms, live.

  2. 02

    Assets

    Health, AMC and PPM status for every asset.

  3. 03

    Workforce

    Where teams are and what they are doing.

  4. 04

    Checklists and passes

    Every checklist, permit and gate pass, signed.

  5. 05

    SLAs

    Response and resolution against target.

  6. 06

    Insights

    Trends and exceptions, surfaced early.

Signature offer · Intellisia Control Tower

From boardroom to ground zero.

One live view. Every level acts before issues escalate.

Control TowerSample data

Sites live

7 / 7

SLA compliance

94%

Open risks

3

Cost vs plan

−4.2%

Operating cost index, last 12 months

Reactive

Hear about it after the complaint.

Proactive

Alerted before the SLA slips.

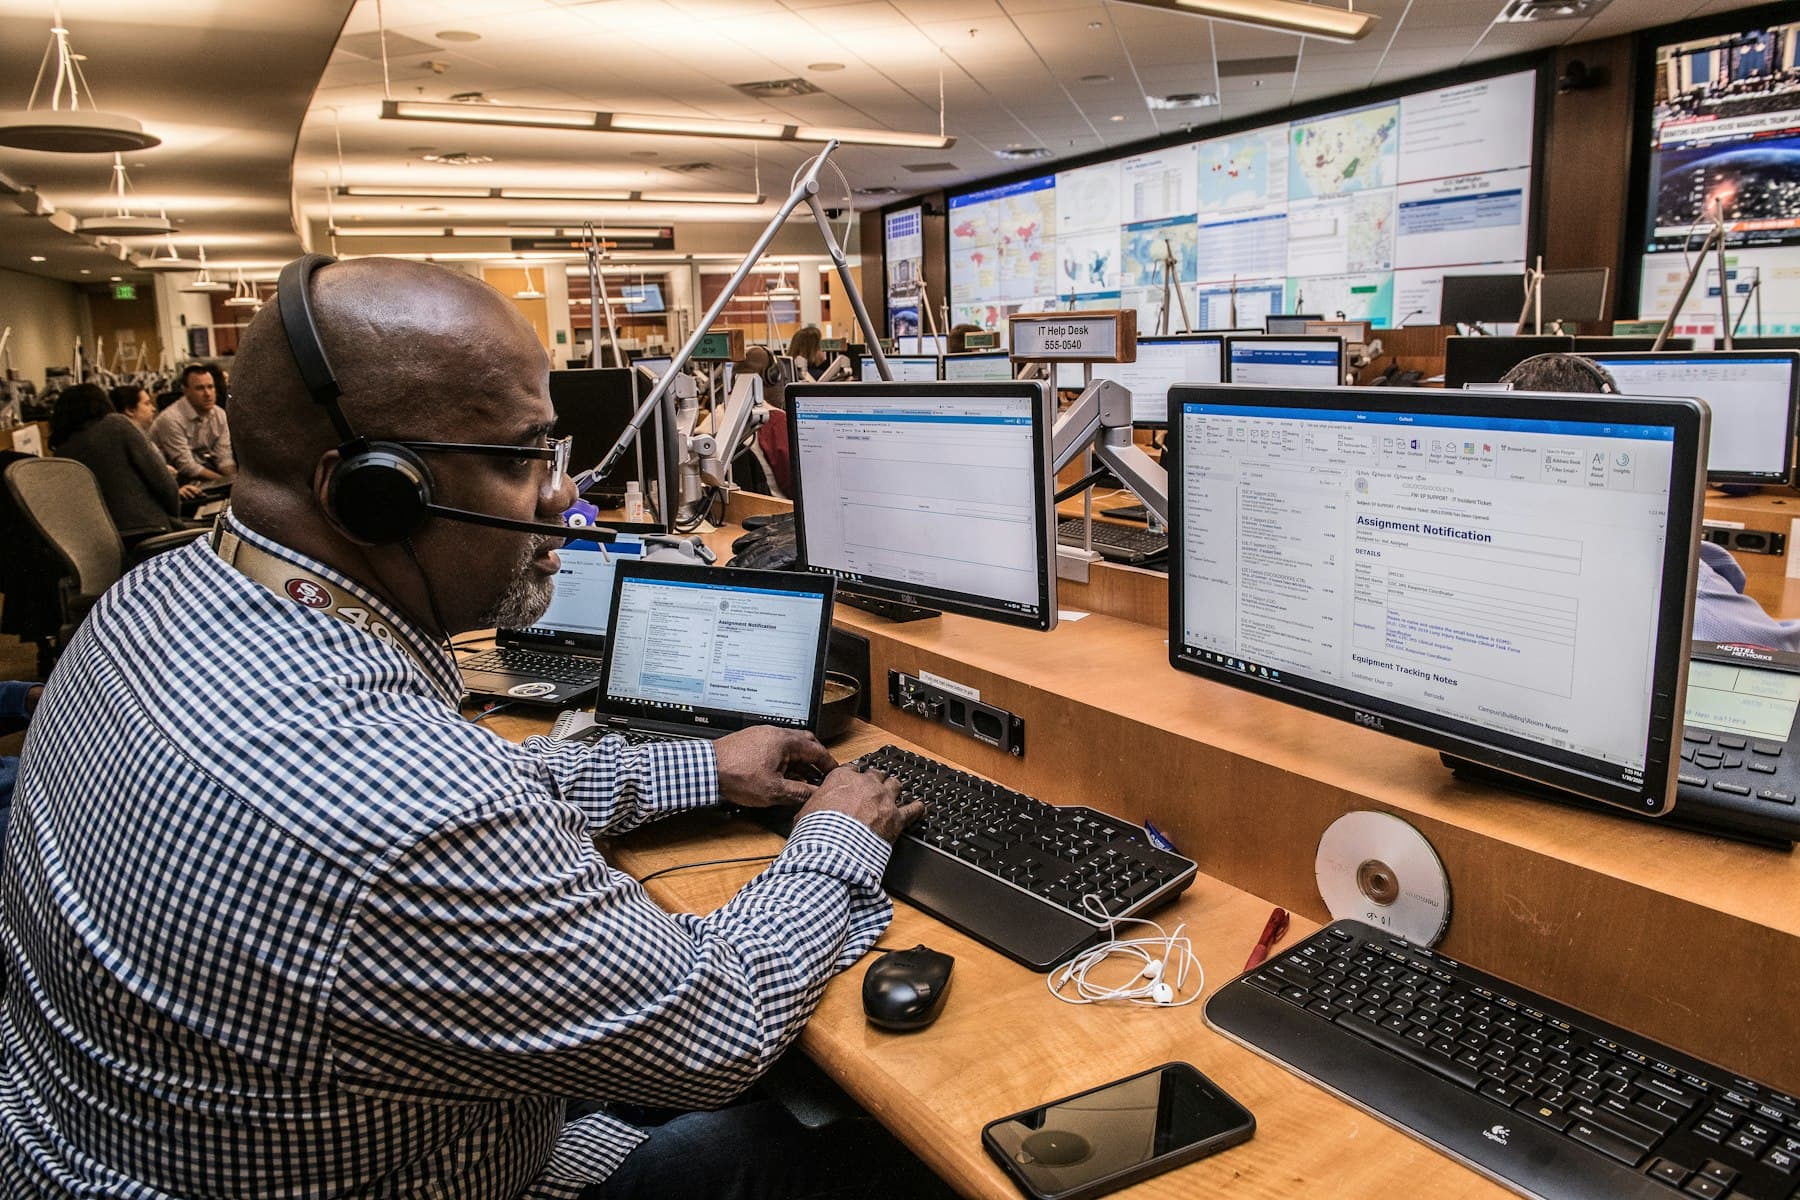
Operations team working in a command center

Risk · Hospitals

Command Center

Challenge
Leadership heard about problems only after complaints or month-end reports.
What we did
Built a command center linking boardroom dashboards to ground-level activity.
Result
Management transparency from boardroom to ground zero. Teams moved from reactive to proactive.
Read the full story: Command Center

Start here

Put your sites in one view.

Find out what your operations could save.

  1. 01Discovery call
  2. 02Site walk-through
  3. 03Value assessment
Book a Value Assessment